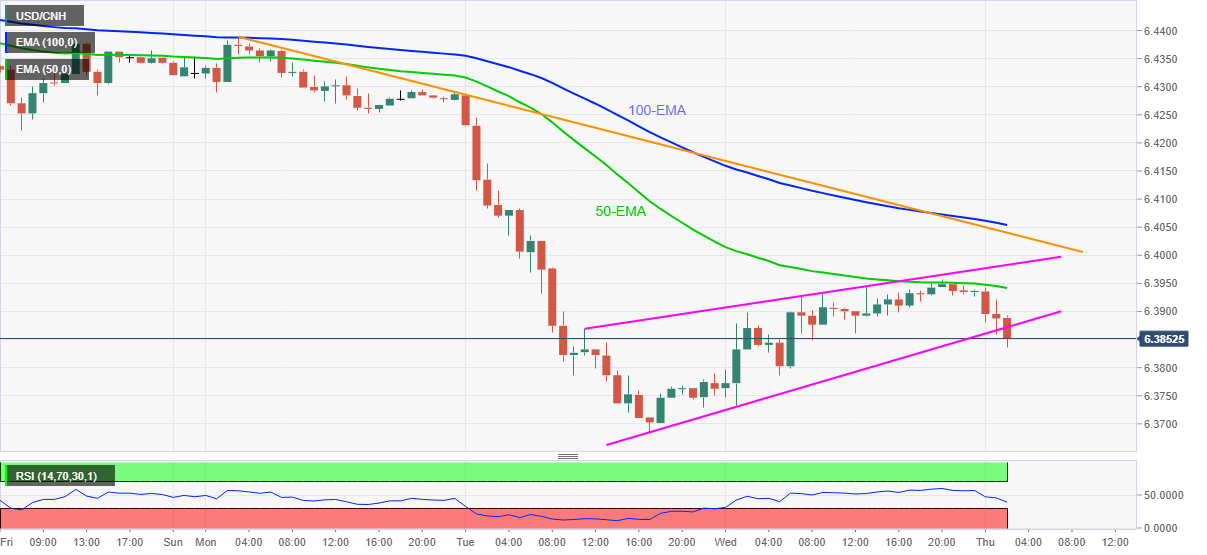
USD/CNH Price Analysis: Confirms rising wedge on H1
- USD/CNH consolidates previous day’s rebound, confirms bearish chart pattern.
- 50-EMA guards immediate upside, convergence of 100-EMA, weekly resistance line becomes the key hurdle.
USD/CNH takes offers to $6.3850, confirming the bearish chart formation during early Thursday. In doing so, the Chinese currency (CNH) pair reverses the previous day’s rebound from the lowest since June.
Given the RSI line having a buffer before hitting the oversold territory, coupled with the rising wedge breakdown, USD/CNH may extend the latest south-run toward the recent multi-day low near $6.3685.
It’s worth noting that the yearly low surrounding $6.3525 will challenge the pair bears afterward, failing to do so can recall the year 2018 bottom close to $6.2360.
Meanwhile, 50-EMA near $6.3940 restricts corrective pullback ahead of the $6.4050-55 resistance confluence, including 100-EMA and a descending trend line from October 18.
Overall, USD/CNH remains in the bearish trajectory and the latest confirmation of the rising wedge adds strength to the seller’s view.
USD/CNH: Hourly chart

Trend: Further weakness expected
