US Dollar Index Price Analysis: Drops back towards 92.00 inside falling wedge
- DXY fades the corrective bounce off five-week-old support line.
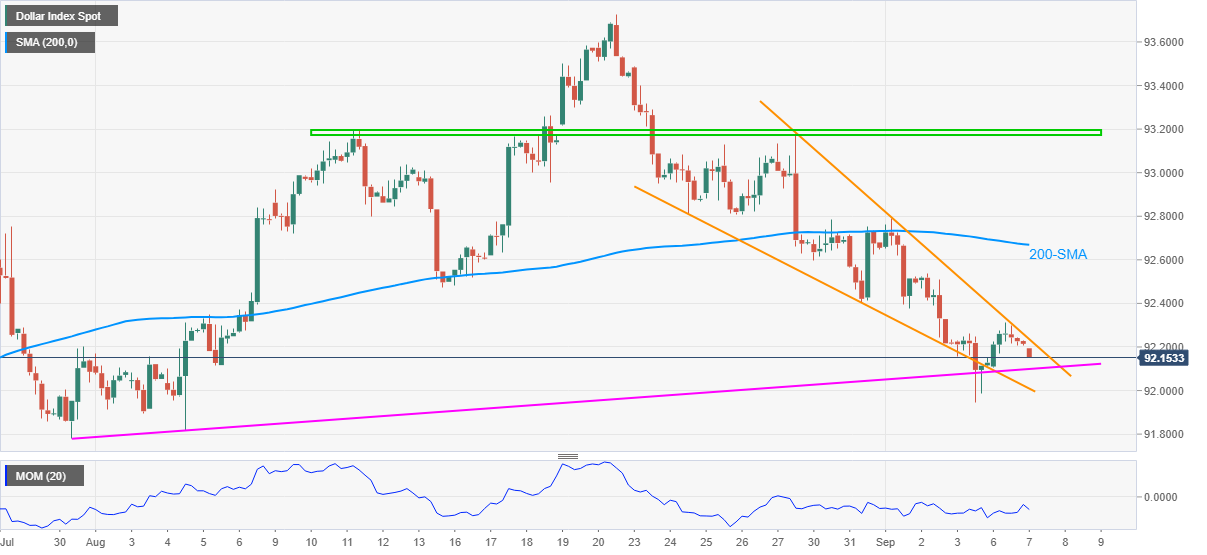
- Bullish chart pattern keeps buyers hopeful but 200-SMA, sluggish Momentum line probe the optimists.
US Dollar Index (DXY) reverses the previous day’s corrective pullback while declining to 92.18, down 0.03% intraday, amid Tuesday’s Asian session.
Even so, the greenback gauge keeps a two-week-old bullish chart pattern, namely falling wedge, while dropping towards an ascending support line from July 30, at 92.10.
Given the quote’s sustained trading below 200-SMA and a pullback move from the stated wedge’s upper line, DXY bears are likely to remain hopeful.
However, the lower line of the wedge, around the 92.00 threshold, will challenge the downside moves before highlighting the July-end lows near 91.78.
Alternatively, an upside clearance of the 92.25 level, comprising the wedge’s resistance line, will confirm the bullish chart pattern and direct the DXY buyers towards the last month’s high near 93.75.
Though, 200-SMA level of 92.66 and monthly horizontal resistance line near 93.20 add to the upside filters.
DXY: Four-hour char
Trend: Further downside expected