Silver Price Analysis: XAG/USD bulls struggle to make it through $24.00 mark
- Silver failed to capitalize on this week’s positive move and edged lower on Wednesday.
- Repeated failures near the $24.00 mark support prospects for some near-term weakness.
Silver reversed an intraday dip to the $23.65 region and moved to the top end of its intraday trading range during the early North American session. The commodity was last seen trading around the %23.80-85 region, nearly unchanged for the day.
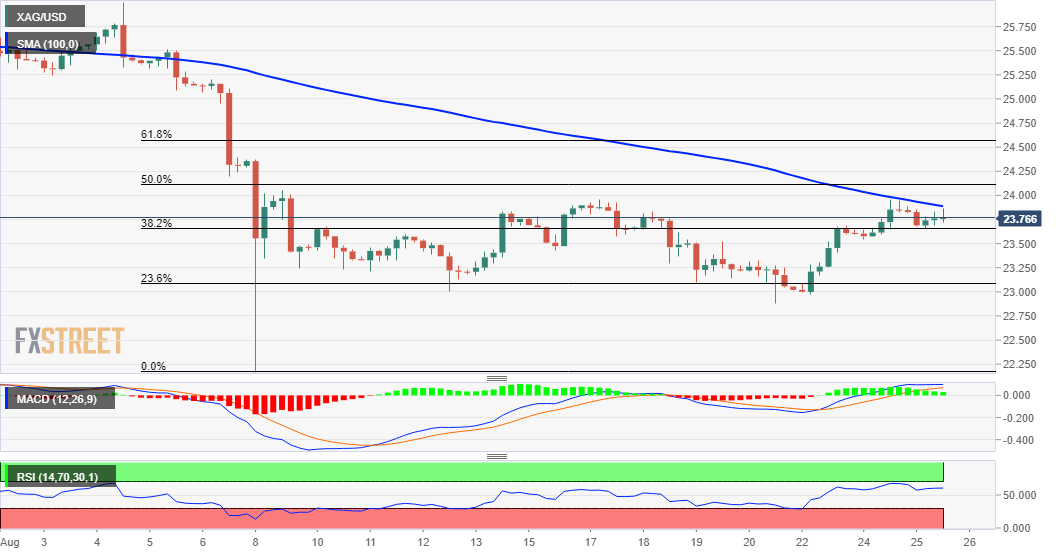
From a technical perspective, the XAG/USD, so far, has struggled to capitalize on this week's gains recorded over the past two trading sessions. The upside remains capped ahead of the $24.00 mark, which coincides with 100-period SMA on the 4-hour chart.
Meanwhile, technical indicators on hourly charts have been gaining positive traction and support prospects for additional gains. That said, oscillators on the daily chart are still holding in the negative territory, warranting some caution for bulls.
Hence, it will be prudent to wait for some strong follow-through buying beyond the $24.00 mark before positioning for any further near-term appreciating move. This is closely followed by the 50% Fibonacci level of the $26.00-$22.17 recent leg down.
A convincing breakthrough the mentioned resistance levels will be seen as a fresh trigger for bulls and lift the XAG/USD towards the $24.55-60 area, or 61.8% Fibo. level. The momentum could further get extended towards the key $25.00 psychological mark.
On the flip side, the overnight swing lows, around the $23.45-40 region, coinciding with the 38.2% Fibo. level now seems to protect the immediate downside. Sustained weakness below might prompt some technical selling and turn the XAG/USD vulnerable.
The next relevant support is pegged near the $23.00 mark, below which the XAG/USD seems all set to accelerate the slide. Bears might then drag the metal to intermediate support near mid-$22.00 en-route YTD lows, around the $22.20-15 region touched earlier this month.
Silver 4-hour chart
Technical levels to watch