Silver Price Analysis: XAG/USD sticks to modest gains near $26.00 mark, bearish bias remains
- Silver gained some positive traction on the first day of a new week, lacked follow-through.
- The bias remains tilted in favour of bearish traders amid the formation of a flag pattern.
- Mixed oscillators on hourly/daily charts warrant caution before placing aggressive bets.
Silver built on the previous session's goodish rebound from three-day lows and edged higher through the Asian session on Monday, albeit lacked any strong follow-through. The commodity was last seen trading around the $26.00 mark, up around 0.60% for the day.
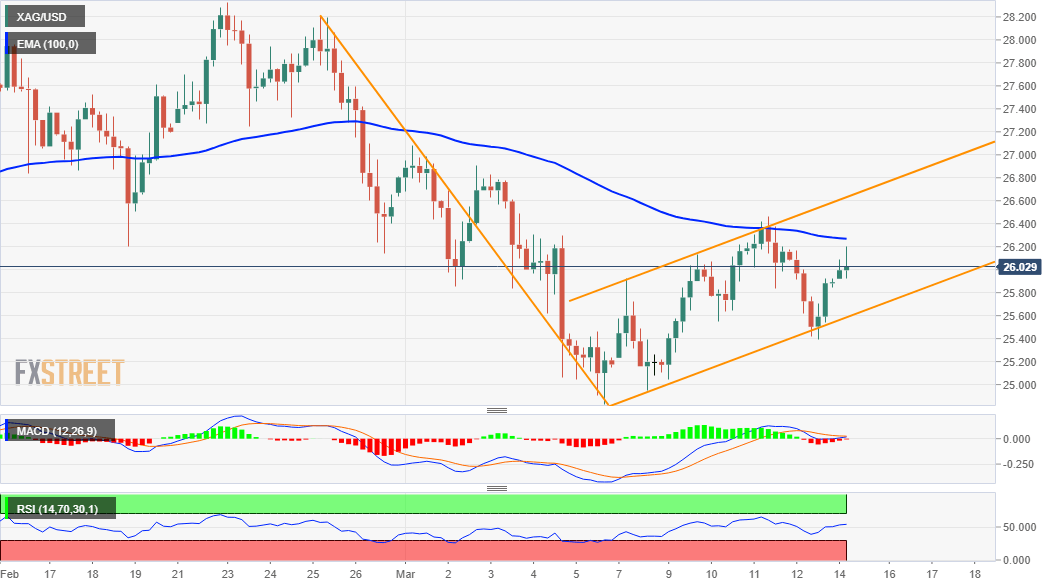
From a technical perspective, the XAG/USD, so far, has been struggling to capitalize on the uptick beyond the 100-period EMA on the 4-hourly chart. This, along with the formation of a bearish flag pattern on the mentioned chart, favours bearish traders.
Meanwhile, technical indicators on hourly charts have been gaining some positive traction. That said, oscillators on the daily chart have just started drifting into the bearish territory and warrant caution before positioning for any meaningful upside.
However, it will still be prudent to wait for a convincing break below the trend-channel support, currently near the $25.60 region before positioning for any further slide. The XAG/USD might then accelerate the fall towards the key $25.00 psychological mark.
Some follow-through selling below monthly swing lows, around the $24.85-80 region should pave the way for a further decline. The downward trajectory has the potential to drag the XAG/USD towards the very important 200-day SMA support, currently around the $24.00 mark.
On the flip side, immediate resistance is pegged near the $26.30 region (100-period SMA on the 4-hourly chart). A sustained strength beyond might trigger a short-covering move and push the XAG/USD towards the channel resistance, around the $26.70-75 region.
XAG/USD 4-hourly chart
Technical levels to watch