EUR/USD Price Analysis: Bears take on deeper demand territory below 1.2000
- EUR/USD bears reach the monthly downside support structure.
- Bears will need to convincingly break two critical layers of support.
As per the prior analysis, The Chart of the Week: EUR/USD enters the bear's lair, the price has indeed continued to the monthly support.
Prior analysis, Monthly charts

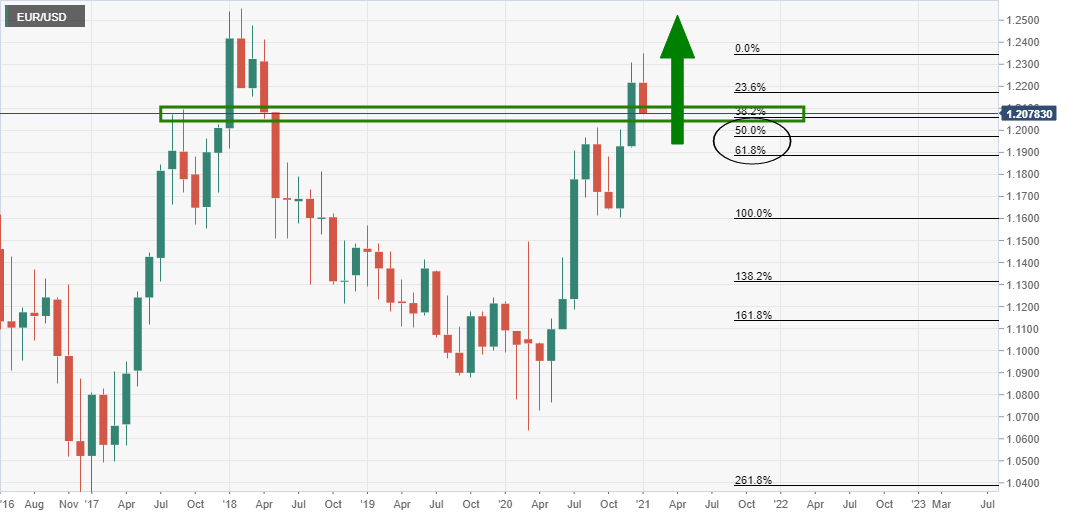
The monthly chart has corrected to a 38.2% Fibonacci retracement level, but there could still be some more room to go until the correction meets prior resistance.
In doing so, there will be a bearish prospect on the lower time frames before the bulls take back control.

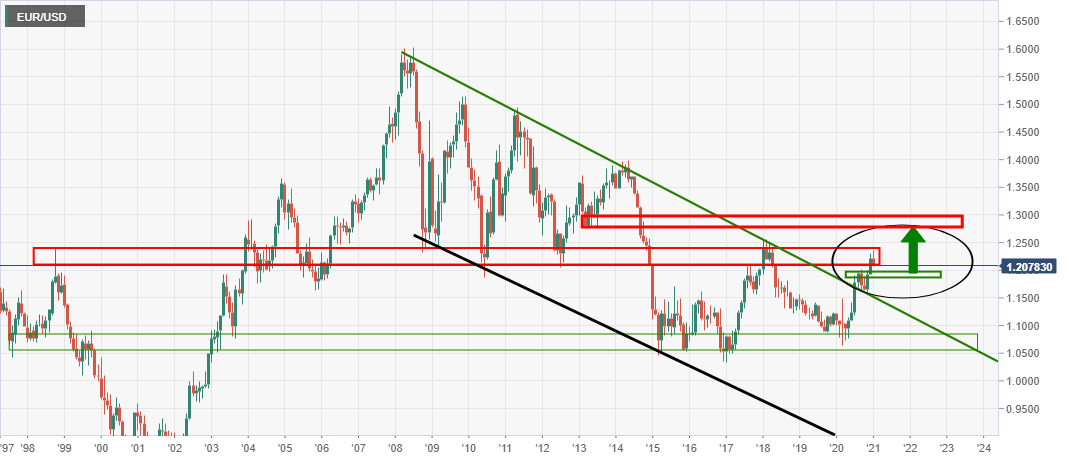
In the last chart above, it was illustrated that there would be expectations of an upside continuation from this juncture.
The following is a top-down analysis that brings us up to date with the latest price action.
Live markets, monthly chart

The price has retraced to the expected support zone which may now see the price stabilise before attempting to correct higher and even extend the upside.
Weekly chart

The 61.8% Fibonacci retracement level on the weekly bullish impulse has been met in this supply and its confluence with prior resistance is compelling.
Daily chart

While there is every possibility of a downside continuation, a 50% mean reversion level meets prior support which may offer resistance if the price corrects higher from support.
Only a break of ower structure would offer convincing downside potential.
