Back
3 Feb 2020
USD/JPY Price Analysis: 200-day SMA, 50% Fibonacci question further selling
- USD/JPY bounces off 18-day low amid bearish MACD.
- An ascending trend line since October 03, 2019, will add to the support.
- 100-day SMA, the nine-day-old falling trend line offers immediate resistance.
USD/JPY pulls back to 108.48 during the Asian session on Monday. In doing so, the pair recovers from 200-day SMA and 50% Fibonacci retracement of its run-up from October 2019 to January 2020.
With this, a 100-day SMA level of 108.75 and a downward sloping trend line since January 21, near 109.00, are on the buyers’ radar.
Should there be further recovery beyond 109.00, multiple upside barriers around 109.75 will be the keys to watch.
Alternatively, a daily closing below 200-day SMA and 50% Fibonacci retracement around 108.40 could drag prices to 108.00-107.95 support confluence that includes a 17-week-old rising support line and 61.8% Fibonacci retracement levels.
USD/JPY daily chart
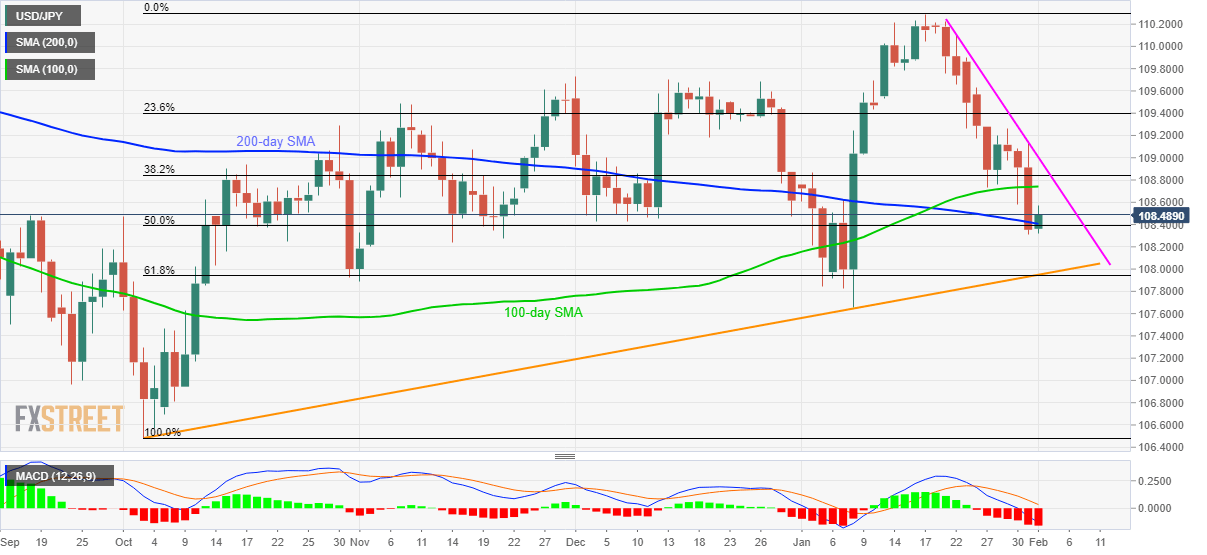
Trend: Pullback expected