Back
31 Jan 2020
EUR/USD Price Analysis: Bounce stalls at trendline hurdle
- EUR/USD is pressing into key trendline hurdle on the 4-hour chart.
- Indicators and daily candles are reporting early signs of bullish reversal.
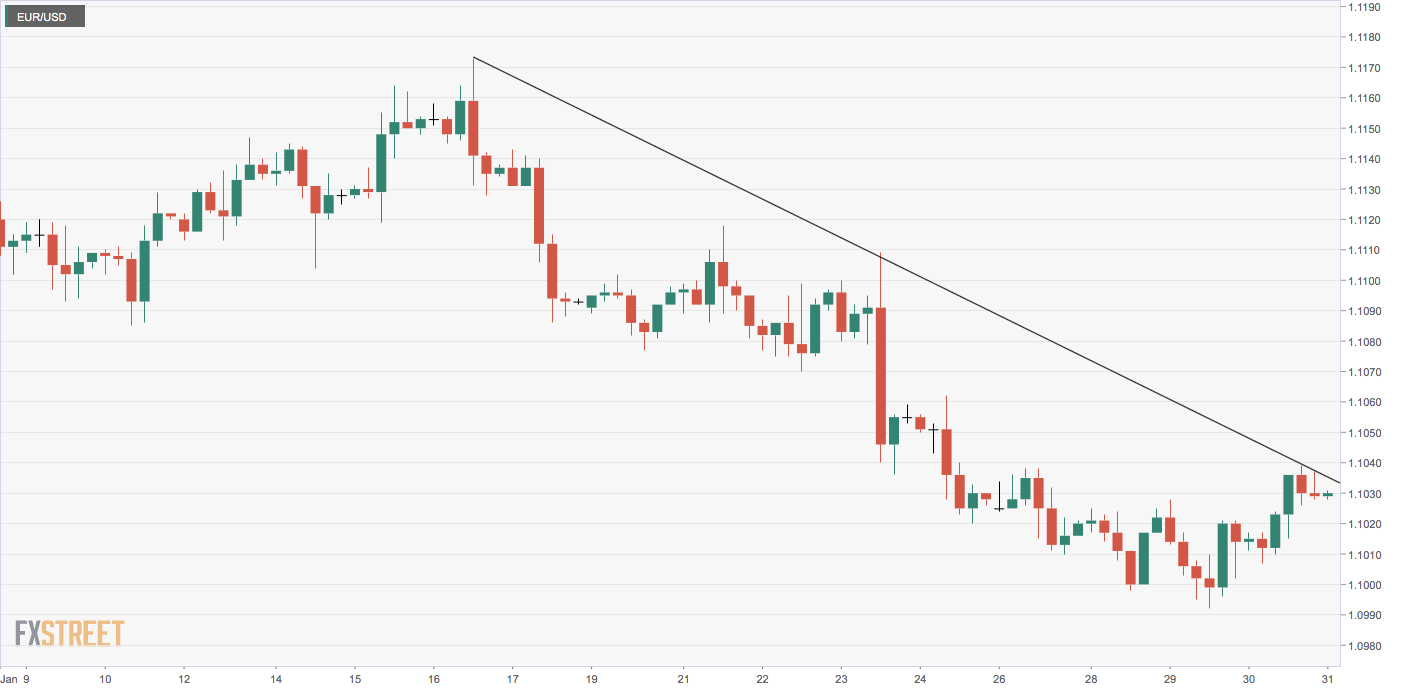
EUR/USD is currently trading at 1.1029, having hit a high of 1.1040 in the overnight trade.
The 4-hour chart shows the bounce from the weekly low of 1.0992 has stalled at the trendline sloping downwards from Jan. 16 and Jan. 23 highs.
A break above the trendline hurdle would validate the bullish divergence of the relative strength index and open the doors to 1.1080.
The possibility cannot be ruled out, as the daily candlesticks are beginning to paint a bullish picture. The pair eked out 0.20% gains on Thursday and closed above Wednesday’s high of 1.1028, confirming the seller exhaustion at 1.10 signaled by consecutive long-tailed daily candles.
The outlook would turn bearish if the spot finds acceptance under 1.10.
Daily chart
Trend: Bullish
Technical levels