Back
30 Oct 2019
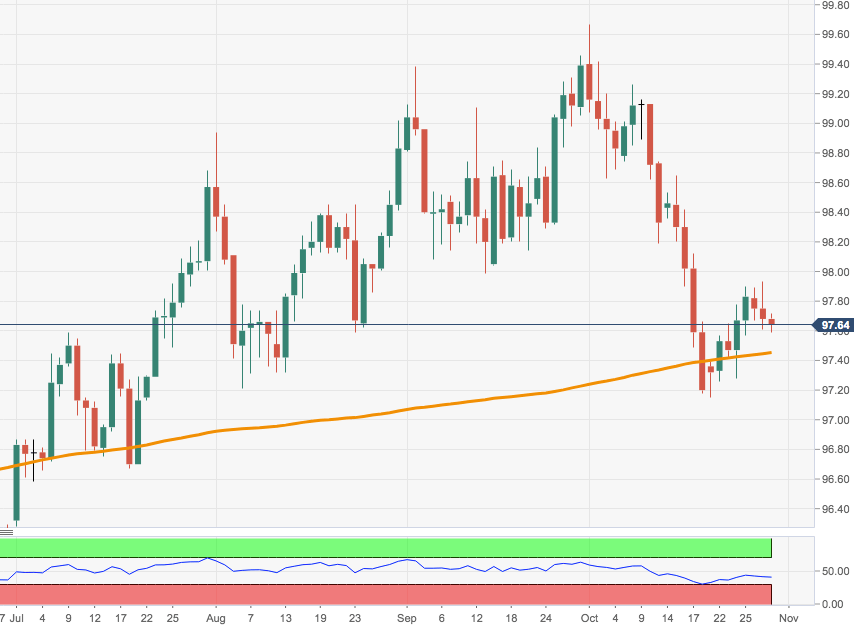
US Dollar Index Technical Analysis: Correction lower could extend further and test the 200-day SMA near 97.40
- The index continues to correct lower after failing to break above the 97.90 region, where converge the 100-day SMA (97.84) and the Fibo retracement of the 2017-2018 drop (97.87).
- Interim support if the continuation of the down move materializes appears at the 10-day SMA at 97.55.
- Further south emerges the critical 200-day SMA at 97.43. Below this area, the bearish view is expected to return to the market.
DXY daily chart