EUR/USD is capped at 1.1113 and may opt for the downside – Confluence Detector
EUR/USD has kicked off a busy week on the back foot. Can it recover? The technical situation is unpromising.
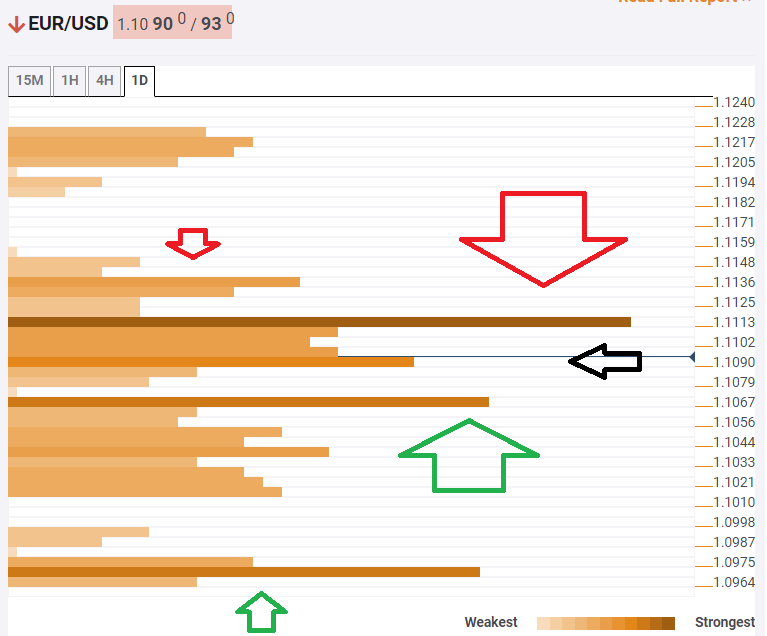
The Technical Confluences Indicator is showing that EUR/USD faces fierce resistance at 1.1113, which is a dense cluster of lines including the Simple Moving Average 5-one-day, the SMA 100-1h, the SMA 10-one-day, and the previous monthly high among others.
If the currency pair breaks, higher, some resistance awaits at 1.1136, which is where the Pivot Point one-week Resistance 2 and the Bollinger Band 4h-Upper converge.
Some support awaits at 1.1090, which is the confluence of the PP one-week Resistance 1, the Fibonacci 61.8% one-day, and the SMA 10-4h.
Next, 11067 is the convergence of the previous weekly high, the PP one-day S2, the BB 4h-Lower, and the SMA 100-4h.
The downside target is 1.0970, which is the meeting point of the Fibonacci 38.2% one-month and the PP one-week S1.
All in all, the path of least resistance is to the downside.
Here is how it looks on the tool:
Confluence Detector
The Confluence Detector finds exciting opportunities using Technical Confluences. The TC is a tool to locate and point out those price levels where there is a congestion of indicators, moving averages, Fibonacci levels, Pivot Points, etc. Knowing where these congestion points are located is very useful for the trader, and can be used as a basis for different strategies.
This tool assigns a certain amount of “weight” to each indicator, and this “weight” can influence adjacents price levels. These weightings mean that one price level without any indicator or moving average but under the influence of two “strongly weighted” levels accumulate more resistance than their neighbors. In these cases, the tool signals resistance in apparently empty areas.
Learn more about Technical Confluence