GBP/USD technical analysis: Breaks 5-week old resistance-line while aiming 200-bar MA
- Break of immediate resistance-line favors further upside to 200-bar MA.
- Overbought RSI might recall sellers if prices dip below 23.6% Fibo.
In addition to flashing fresh weekly high, the GBP/USD pair also clears near-term trend-line resistance as it takes the bids around 1.2693 heading into the British market open on Thursday.
While a sustained break of 1.2690 resistance-line enables the quote to rise further towards 200-bar moving average (MA) level of 1.2741, 38.2% Fibonacci retracement of May-June downpour, at 1.2763, may question additional increases.
Further, May 21 high of 1.2815 and 50% Fibonacci retracement of 1.2842 can please buyers during a rally past-1.2763.
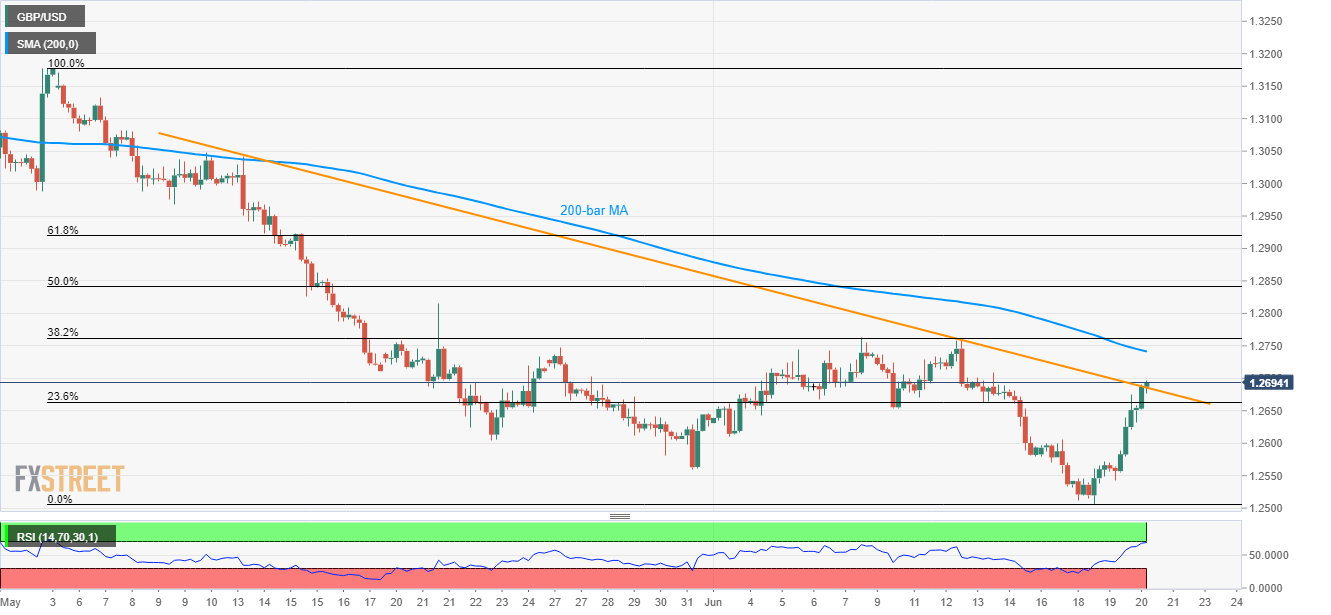
On the downside, 23.6% Fibonacci retracement level of 1.2666 offers immediate support to watch if overbought levels of 14-bar relative strength index (RSI) play its role.
In a case where sellers slip in after 1.2666, 1.2610 and May-end low of 1.2560 can entertain them ahead of questioning the declines with the latest bottom close to 1.2500 mark.
GBP/USD 4-Hour chart
Trend: Bullish