Ethereum Technical Analysis: ETH/USD rises to 150.00 level and gains 8% on Monday
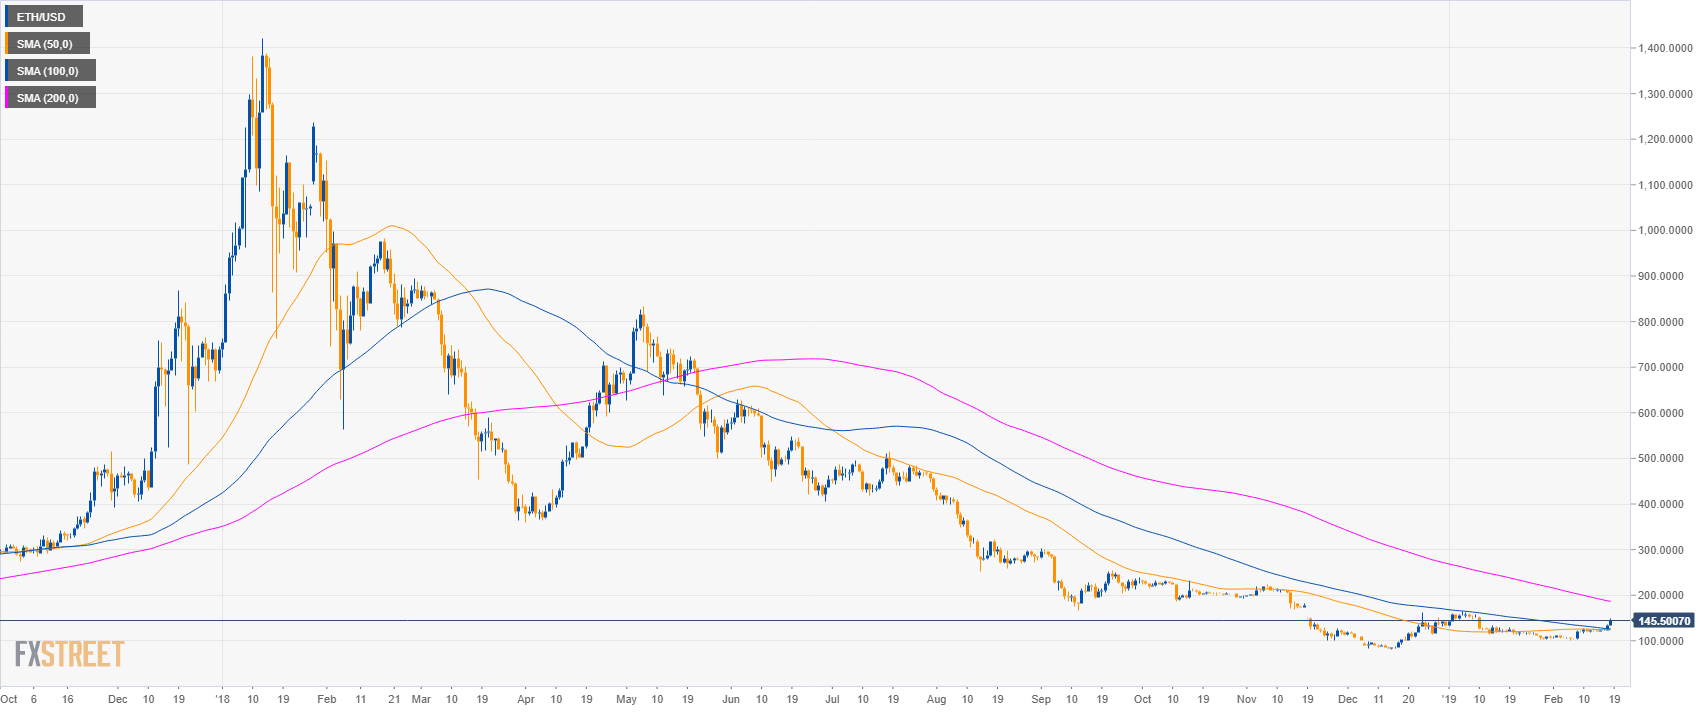
ETH/USD daily chart
- ETH/USD is trading below the 200-day simple moving averages (SMAs) on the daily chart.
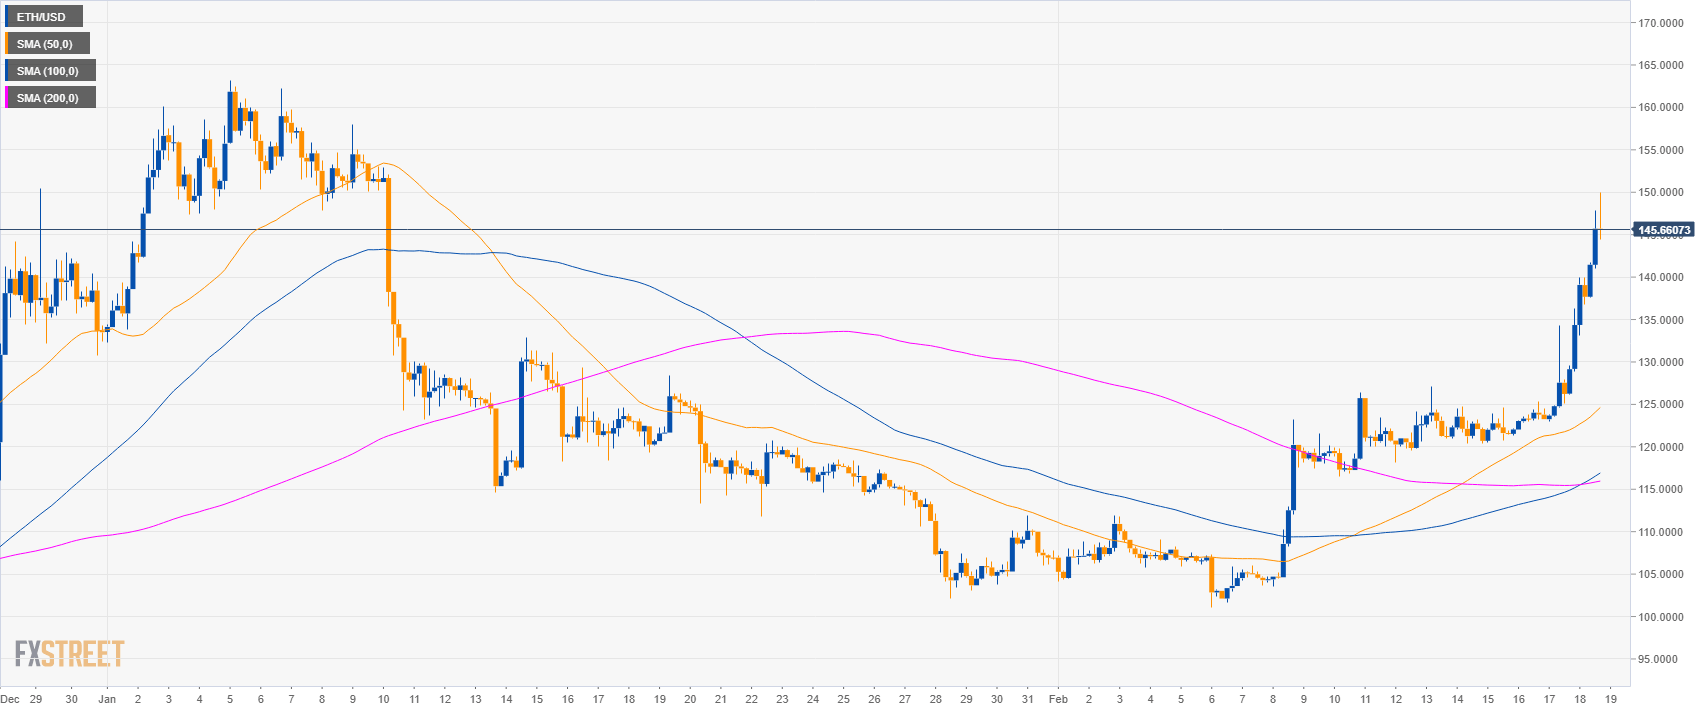
ETH/USD 4-hour chart
- ETH/USD is trading above its main SMAs suggesting bullish momentum in the medium-term.
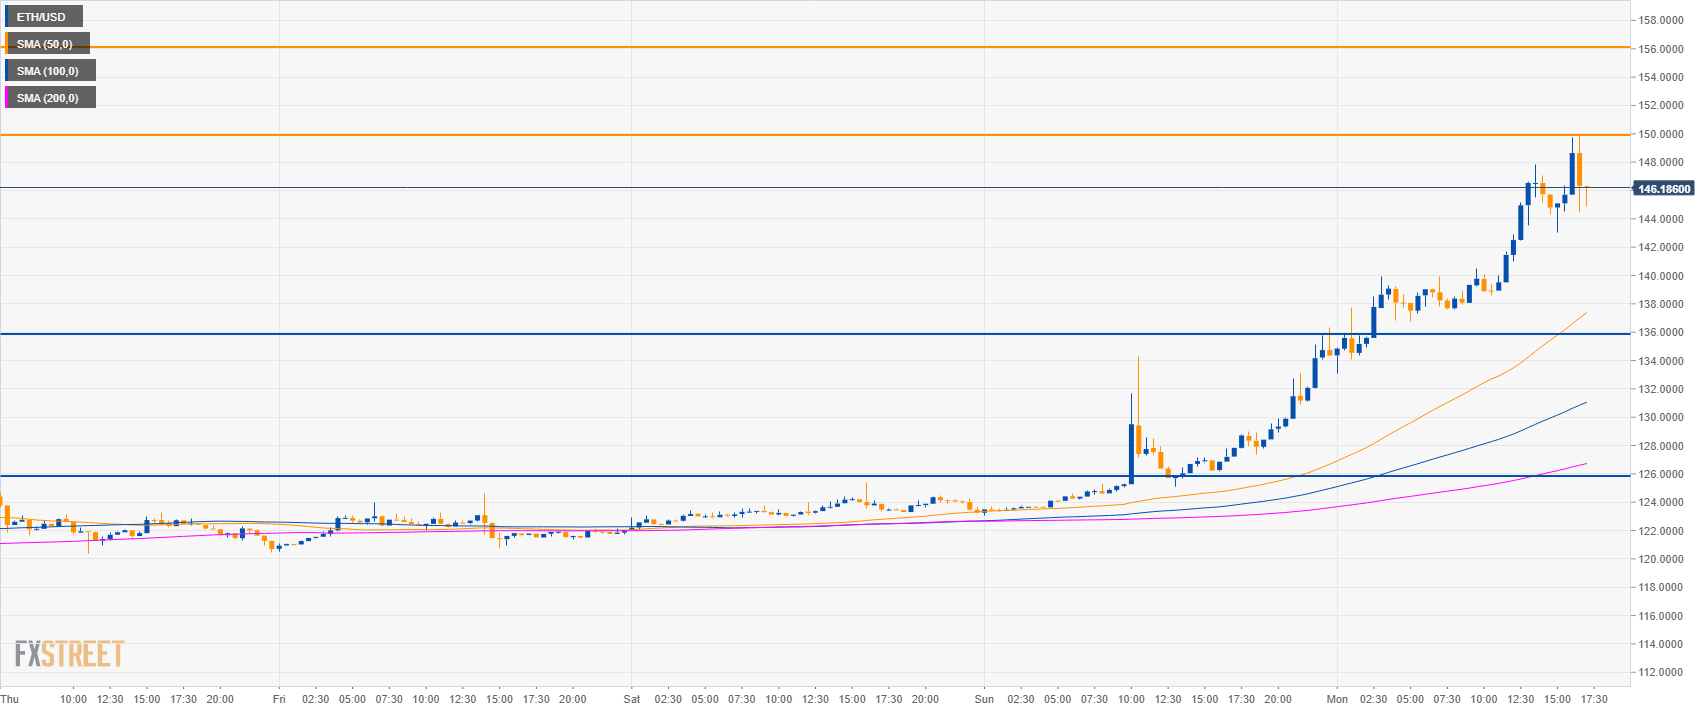
ETH/USD 30-minute chart
- ETH/USD is trading above its main SMAs suggesting bullish momentum in the short-term.
- The level to beat for bulls is 150.00. If broken to the upside, the next resistance is seen at 156.00 level.
- To the downside, support is seen at 136.00 and 126.00 level.
Additional key levels
ETH/USD
Overview:
Today Last Price: 145.58
Today Daily change %: 8.36%
Today Daily Open: 134.35
Trends:
Daily SMA20: 114.99
Daily SMA50: 124.25
Daily SMA100: 127.1
Daily SMA200: 189.21
Levels:
Previous Daily High: 136.34
Previous Daily Low: 123.04
Previous Weekly High: 127.09
Previous Weekly Low: 116.48
Previous Monthly High: 163.23
Previous Monthly Low: 102.17
Daily Fibonacci 38.2%: 131.26
Daily Fibonacci 61.8%: 128.12
Daily Pivot Point S1: 126.15
Daily Pivot Point S2: 117.94
Daily Pivot Point S3: 112.84
Daily Pivot Point R1: 139.45
Daily Pivot Point R2: 144.55
Daily Pivot Point R3: 152.75