Gold Technical Analysis: Manages to hold above 200-hour EMA/trading range support
• The precious metal has been oscillating in a broader trading range over the past week or so, forming a rectangular chart pattern on short-term charts.
• The fact that bulls have repeatedly failed to make it through the key $1300 psychological mark points to a possible long-unwinding pressure in the near-term.
• Moreover, technical indicators on hourly charts have just started losing positive momentum and further add credence to expectations of some follow-through pull-back.
• However, the lower end of the trading range now coincides with 200-hour EMA and acting as immediate strong support since the US trading session on Tuesday.
Gold 1-hourly chart
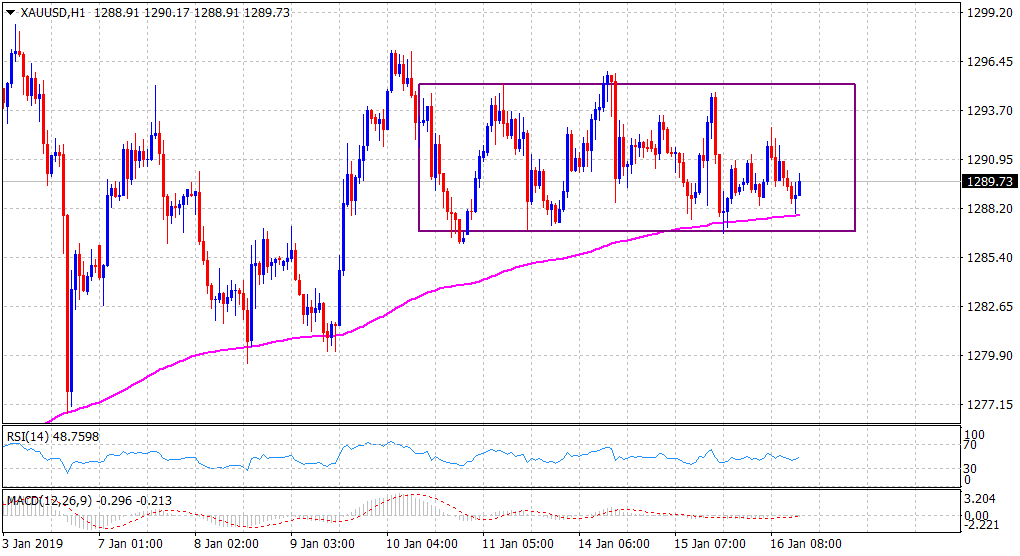
• Hence, it would be prudent to wait for a sustained breakthrough the mentioned support before traders start positioning for any further near-term downtick.
• Alternatively, a sustained breakthrough the trading range resistance, leading to a subsequent strength beyond the said handle will negate any short-term negative outlook.
XAU/USD
Overview:
Today Last Price: 1289.7
Today Daily change: 64 pips
Today Daily change %: 0.0496%
Today Daily Open: 1289.06
Trends:
Previous Daily SMA20: 1278.53
Previous Daily SMA50: 1247.69
Previous Daily SMA100: 1230.43
Previous Daily SMA200: 1228.94
Levels:
Previous Daily High: 1294.75
Previous Daily Low: 1286.95
Previous Weekly High: 1297.15
Previous Weekly Low: 1279.35
Previous Monthly High: 1284.7
Previous Monthly Low: 1221.39
Previous Daily Fibonacci 38.2%: 1289.93
Previous Daily Fibonacci 61.8%: 1291.77
Previous Daily Pivot Point S1: 1285.76
Previous Daily Pivot Point S2: 1282.45
Previous Daily Pivot Point S3: 1277.96
Previous Daily Pivot Point R1: 1293.56
Previous Daily Pivot Point R2: 1298.05
Previous Daily Pivot Point R3: 1301.36