Back
11 Sep 2018
AUD/USD Technical Analaysis Eyeing relief rally after inverted bullish hammer
- The AUD/USD pair created a bullish inverted hammer yesterday. Further, it qualifies as a bullish inside-day candle. As a result, today's close is pivotal.
- A close today above previous day's high of 0.7132 would indicate that the AUD has made a temporary low at 0.7092 and could yield sideways to positive action in the next few days.
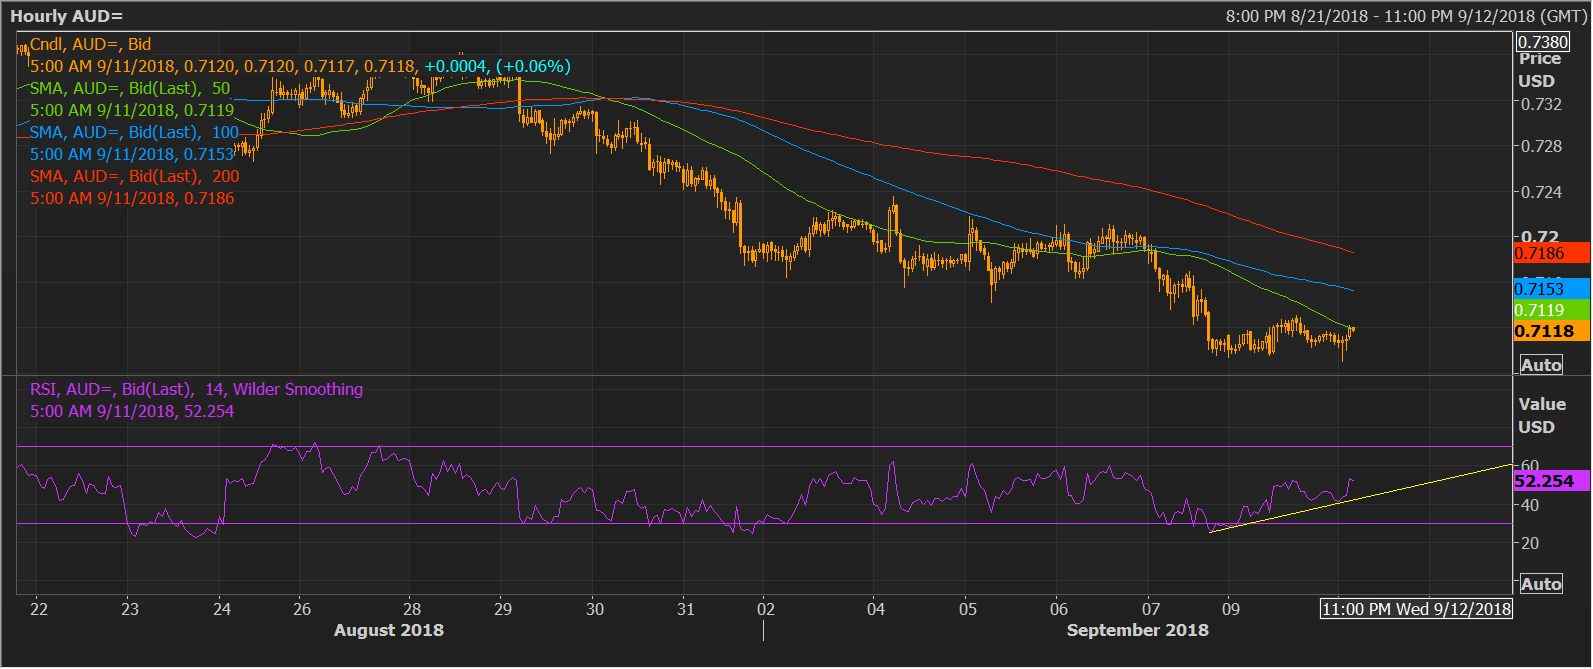
- The bullish divergence of the hourly relative strength index (RSI) and the 4-hour chart RSI does signal a scope for a positive close above 0.7132.
Hourly chart

Daily chart
-636722353585377384.png)
Spot Rate: 0.7118
Daily High: 0.7122
Trend: Bullish
Resistance
R1: 0.7145 (Sep. 5 low)
R2: 0.7185 (10-day moving average)
R3: 0.7202 (Aug. 15 low)
Support
S1: 0.7081 (pivot S1)
S2: 0.7048 (pivot S2)
S3: 0.70 (psychological support)
