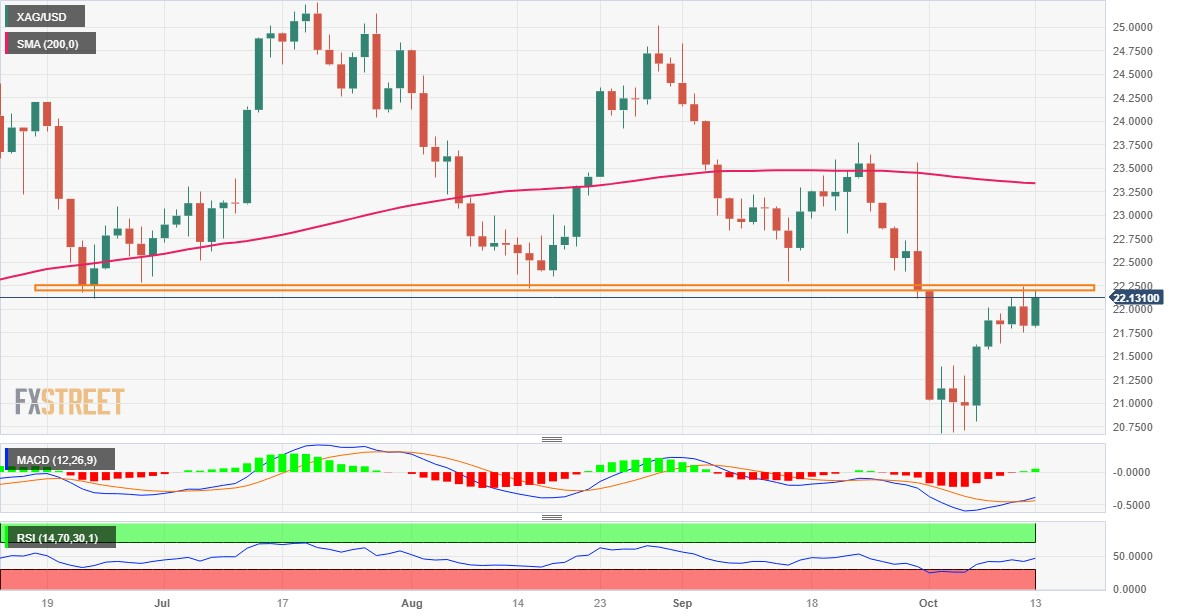
Silver Price Analysis: XAG/USD bulls need to make it through $22.30 support-turned-hurdle
- Silver regains positive traction on Friday and climbs back closer to a near two-week high.
- Neutral oscillators on the daily chart warrant some caution for aggressive bullish traders.
- Any meaningful corrective slide is likely to attract fresh buyers near the $21.60-55 region.
Silver builds on its intraday gains through the first half of the European session on Friday and jumps back closer to a nearly two-week high touched the previous day, though remains below the $22.30 strong horizontal support breakpoint.
Neutral technical indicators on the daily chart, meanwhile, make it prudent to wait for some follow-through buying beyond the aforementioned support-turned-resistance before positioning for any further appreciating move. The XAG/USD might then accelerate the momentum towards reclaiming the $23.00 mark before aiming to challenge the very important 200-day Simple Moving Average (SMA), currently pegged around the $23.35 area.
The latter should act as a key pivotal point for short-term traders, which if cleared decisively will set the stage for an extension of the recent recovery move from the $20.70-$20.65 region, or a multi-month low touched last week. The subsequent move up has the potential to lift the XAG/USD towards the next relevant hurdle near the $23.75-$23.80 region (September 22 high) en route to the $24.00 round figure and the $24.30-$24.35 resistance zone.
On the flip side, the $21.75 horizontal support might continue to protect the immediate downside ahead of the $21.60-$21.55 zone
or the weekly low. Some follow-through selling could drag the XAG/USD back towards a multi-day-old trading range resistance breakpoint, turned support, around the $21.3-$21.30 region en route to the $21.00 mark. The downward trajectory could get extended towards the $20.70-$20.65 region, or a seven-month low.
Silver daily chart

Technical levels to watch
